The Reality of Red Numbers

The Reality of Red Numbers

12 years ago 0 0 1827

What’s your guess as to how many months the stock market declines or rises each year? And in bad vs. good markets? Our yearly update of “The Reality of Red Numbers” shows you, and illustrates that market volatility is often a reasonable price to pay as part of a diversified portfolio, to help capture long-term positive returns… whereas inflation (purchasing power risk) is often a more harmful risk in the long-run.

Reality of Red Numbers (S&P 500) WealthStep Version_Page_1

S&P 500 Index returns provided by third party sources believed to be reliable. Past performance is not a guarantee of future results.
Illustrations are intended as general information, and are not specific investment advice. The S&P 500 index represents just one of many investment markets that an efficient, diversified portfolio should consider.


Quarterly Thoughts – Q1 2014

12 years ago 0 0 1946

Are there clear patterns of investment market returns over time?  How does a “balanced” portfolio compare to individual asset classes over time?  Our chart entitled “The Periodic Table of Investment Returns – A Case for Diversification Amid Uncertainty” is a colorful illustration that addresses these questions.

People are not naturally wired for investing.  Without discipline, it is human nature to make mental errors, often due to “recency bias” and the “flight” reflex.  Recency bias is the tendency for people to believe that the future will be like the present.  For example, if stocks are hot, the average investor often ignores risk and increases equity holdings.  Then, when a market correction occurs, those that increased their holdings in stocks (i.e. risk) increase their chance of a flight or panic reflex.  The result is often economic damage caused by emotional “buy-high, sell-low” investing.

Rational asset allocation across many styles, and the discipline to re-balance to your asset allocation, is the key to long-term success. A diversified portfolio approach will combine many or all of these and other asset classes (as appropriate for your specific goals) to reduce price fluctuation risk, or “volatility,” and provide a more predictable and smoother financial journey.

Quarterly Thoughts – Q4 2013

12 years ago 0 0 1750

Will a disciplined investment process improve your health?  Recent research says yes.  Stress caused by dramatic market movements, the financial press, and investors’ common behavioral mistakes can make people feel queasy… or worse. A March 2013 study by the University of California at San Diego found that hospitalizations rise on days when stock market prices fall. Another study published in the American Journal of Cardiology showed a significant correlation between a period of stock-market decrease and rates of heart attacks.

By helping clients develop and staying focused on their goals, and applying a prudent process, our clients are better able to separate emotions from short-term market movements. The result is greater peace of mind, and possibly health.

Quarterly Thoughts – Q3 2013

12 years ago 0 0 1974

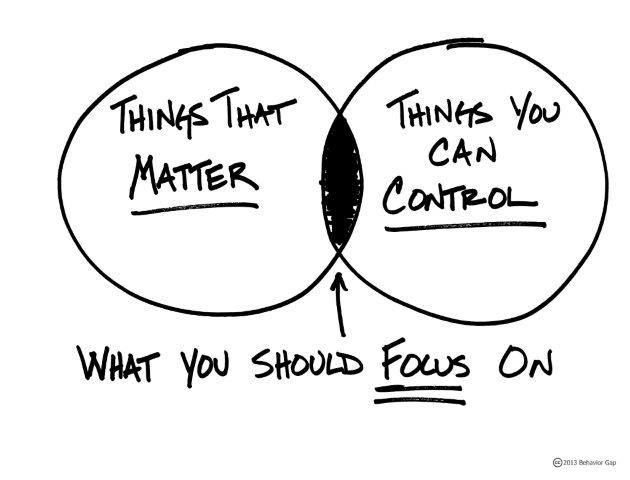
Consider focusing where you can make an impact, in terms of your life goals and financial goals.

Ven diagram

The simplicity of this diagram is profound.  The world around us is complex and full of “noise,” both statistical and theatrical (e.g. TV news, etc.).  The senses are bombarded with eye and ear-catching attempts to grab your attention.  The challenge is to remain focused on what counts.

Insufficient focus leads to distraction and the jeopardizing of goals. The answer is to remain focused on what matters that you can control: behaviors that help you achieve your life/financial goals, with the right support and process to help you more systematically get where you want to go.

Quarterly Thoughts – Q2 2013

13 years ago 0 0 1759

In investing, “normal” is an elusive idea.  Long-term average returns are relevant for planning, but rarely does a stock market calendar year return fall within a range of 2 percentage points around the average.  If “normal” does exist in the stock and bond markets, it can be loosely defined as a predictably unpredictable sequence of short-term economic events, followed by investor over-reaction and the ensuing volatile returns in the market.

After the second worst market in history hit bottom in March of 2009, disciplined investors were rewarded…as is “normal.”  The cumulative stock market loss was approximately 60%, and the subsequent rise of the S&P 500, through June of 2013, was over 160%.  Small and Mid Cap stock markets rose over 200%.  The S&P 500 return from the previous peak through June 30, 2013, was 16.5%, so is back at new highs.

Those who exhibited disciplined investing were rewarded with the returns above.  Patience is one of the greatest virtues and determinants of investor success.  Our “Reality of Red Numbers” chart for stocks and bonds can help inspire patience by helping you visualize that “normal” frequently involves many short-term negative returns on the road to positive long-term returns.  The front sides show returns by month.  You will notice a lot of red ink, particularly in the stock version.  The back sides show returns by quarter.  There is less red.  Annual returns show less red still.  While not shown, there are almost no periods over 10 years that are red.

If you have a long-term strategy that fits your needs, choose to make patience your “normal” response, and you will be rewarded in the long-run.  There is talk of the “old normal” and the “new normal.”  The most successful investors will be those that accept that there is no “normal,” and then plan and stay the course accordingly.

Quarterly Thoughts – Q1 2013

13 years ago 0 0 1872

Market Volatility is the norm, not the exception.  Yearly, we provide an updated version of the enclosed Periodic Table of Investment Returns.  Given the recent global financial crisis and partial recovery market experience, the table is particularly timely, as it provides a broader perspective.  This chart is a powerful visual demonstration of the unpredictability of investment returns across major asset classes, and indirectly illustrates the importance of diversification, discipline, rebalancing to a target allocation, and controlling risk.

For many investors it is often tempting to go with the “hot hand.” (“The trend is your friend,” as the saying goes.)  Unfortunately, that is often a recipe for financial disaster.  Last year’s top performer is often at, or near, the bottom in the ensuing years.  Rational asset allocation and diversification across many investment styles, and the discipline to rebalance to your asset allocation, is the key to long-term success.

Quarterly Thoughts – Q4 2012

13 years ago 0 0 1789

Despite the sluggish economy and the general perception that there has been limited progress after the global financial crisis, most stock markets rose 16% to 20% for the year, some market indices are now recording new highs, and the current U.S. stock market recovery, adjusted for inflation, is on track to be the fastest recovery amongst those that followed the four worst market crashes of all time.  While this may feel like the equivalent of celebrating that your last case of the flu or hangover wasn’t as bad as  previous such episodes, it is still welcomed information.

Dampening this relatively good news are the effects of historically high levels of divisiveness in Washington.  Congressional approval ratings are at or near all-time lows, as is the willingness to cross party lines to make decisions and progress.  The result has been replays of brinksmanship with the 2012 debt-ceiling debate and “fiscal cliff,” and now the looming debt-ceiling debate of 2013.  While uncertainty about the timing or specifics of decisions in D.C. may cause market volatility, these short-term factors should not cause you to stray from your strategy (and therefore your goals).  We encourage you to take a long-term view, because your most important goals occur over the long-term.