
Why a market correction shouldn’t make you worry
When stock market performance outpaces expectations for an extended period, as it has recently, the anticipation of a market correction (a drop of 10% of more) can worry investors. But, should you be concerned? After all, significant drops in the stock markets are fairly common, as are rebounds and new highs. While market fundamentals play a large role in these fluctuations, so does investor sentiment. This makes it impossible to predict which forces will trigger a market correction or how long or deep the drop will be.
41 years of S&P 500 market corrections
Since 1980 there have been 37 market corrections and 10 of them developed into longer-term bear markets. During this period, the S&P 500 fell by an average of 14.3% intra-year but rebounded with positive annual returns 75% of the time (see chart).
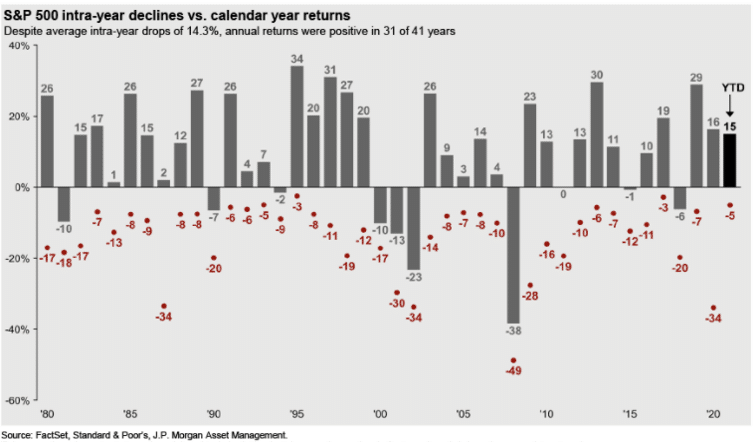
The S&P 500 has risen an average of more than 8% one month after a market correction bottom and more than 24% one year later. In 2020, the start of the pandemic caused a 34% drop, but the year ended up 16% due to government stimulus and intervention by the Federal Reserve. These actions eased investor fears even though economic fundamentals (e.g. unemployment) remained bleak.
There are always strong forces that both drive and hamper economic growth, and they rarely affect stock markets how or when one expects. Current uncertainties: the pandemic, inflation, and China’s economic policies, for example, will be replaced by new uncertainties. Positive expectations of pent-up demand and higher employment offset some of these concerns even though valuations have often taken this into account.
Market corrections and your financial plan
The question of when a market correction may come should not drive investment and planning decisions. For some, the recent higher-than-projected returns in their portfolios mean that a fresh look at planning could allow a reduction in risk exposure or a change in timing of goals. But it is also important to note that a market correction will mean a reversion to the expected returns for long-term planning. For most, it is the long-term that matters: investing so that you can live the life you envision.